


Fast facts:
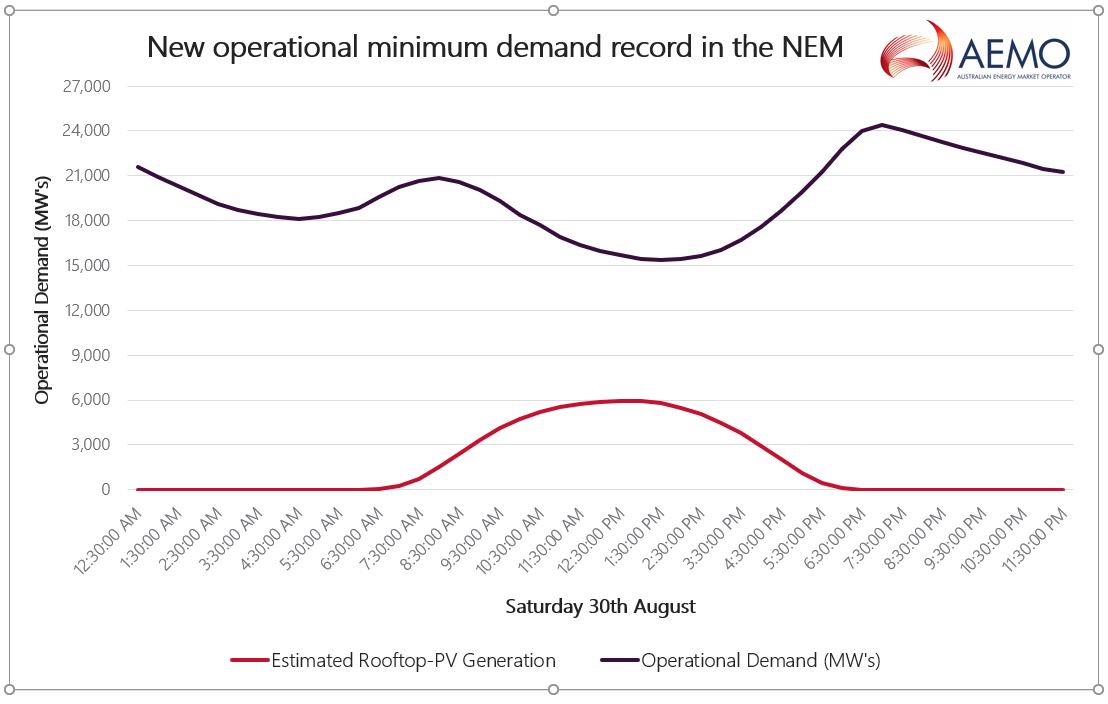
1. The National Electricity Market (NEM) broke a new record for daytime operational demand of 15,365 megawatts (MW)
2. South Australia (SA) and Victoria (VIC) recorded new winter minimum operational demand records of 585 MW and 3,448 MW respectively, and both at the same time: 13:30hrs on Saturday 29th August
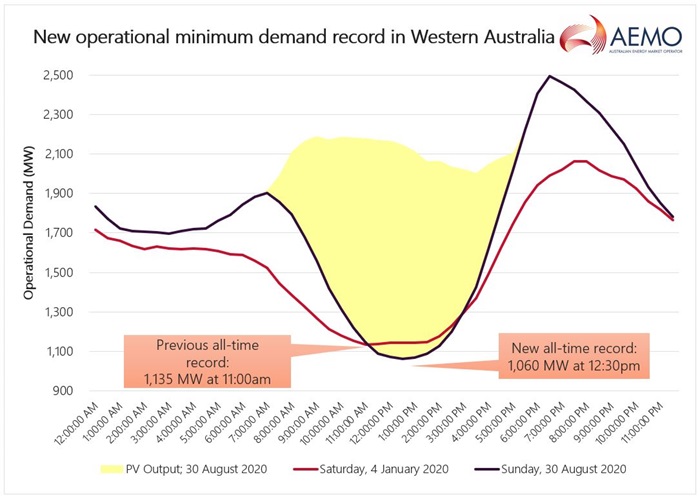
3. A Wholesale Electricity Market (WEM) record was set on Sunday, 30th August when a new low level of demand of 1,060MW was recorded
In further evidence of Australia’s power system
transformation, a mild and sunny weekend across the mainland NEM and WEM
regions, coupled with world-leading levels of rooftop solar PV, resulted in a
remarkable trio of winter minimum operational demand records being set.
In the NEM there was a record daytime operational demand of
15,365 MW recorded, down from the previous record of 16,053 MW on 13 April 2020.
The new record was driven by the aforementioned weather conditions and the
continued growth of rooftop solar PV. All records are kept since the beginning
of 2005 and are half-hourly average time period ending.
South
Australia (SA) and Victoria (VIC) both broke winter minimum operational demand
records of 585 MW and 3,448 MW respectively at t 13:30pm.
Windy conditions meant that SA and VIC also saw scheduled winter demand records broken. Scheduled demand is operational demand minus non-scheduled generation (which is primarily wind in SA & VIC).
Elsewhere in the NEM, NSW didn’t quite break its record as the winter minimum record is currently 5,758 MW from 1 June 2014 and the minimum over the weekend got to 5,844 MW.
Over in the WEM, which supplies approximately 18 terawatt hours of electricity annually to one million customers in WA, the third of the records was set on Sunday at 12:30pm (AWST) operational demand in the WEM reached a record low 1,060 MW, driven by an estimated rooftop solar PV output of 1,086 MW.
This was the third record low set in the last 12 months, a trend driven by ongoing rapid uptake of rooftop solar PV and the new record represents a 6.6% reduction from the previous low, which was 1,135 MW set on Saturday, 4 January 2020.
Different types of demand
At times minimum operational demands, maintaining power system voltages and frequency within both operational and system design limits, is fast emerging as challenging issue to manage. Further information is available in the Renewable Integration Study Appendix A, High Penetrations of Distributed Solar PV.
For context, operational demand means demand supplied from the national power system (or grid) whereas minimum operational demand means the lowest level of demand from the grid in any given day, week or year.
Minimum operational demand is extremely sensitive to ongoing uptake of solar PV, weather conditions, and local economic activity (which may include pandemic restrictions).
The difference between operational and scheduled demand is non-scheduled generation.
- Operational demand is what we forecast as demand.
- Operational demand is always greater than or equal to scheduled demand.
- Scheduled demand is what is dispatched, as it includes both demand and generation.
For a deeper dive into minimum operational demand check out
our comprehensive Energy
Explained edition on the topic.
For all the latest news, insights and analysis from the
Australian energy industry subscribe to our fortnightly
newsletter and download the new Energy Live app on Apple and Android.