


Summary Forecasts
This section shows the impacts of the changed assumptions on annual consumption and maximum demand forecasts, compared to those published in 2017.
Details by region, sector and scenario can be explored from AEMO’s Forecasting Data Portal.
Annual operational consumption
Overall, demand growth is expected to be driven by growth in population, the economy, and appliance ownership, while increasing rooftop PV penetration and energy efficiency measures are projected to have a dampening effect.
The Neutral scenario shows a flat outlook for consumption from the grid for the majority of the 20-year outlook, as increased usage by business and household consumers is offset by customer self-generation and energy efficiency measures. Towards the end of the outlook horizon, some growth is projected driven by increasing uptake of electric vehicles (EVs).
Consumption by Queensland’s coal seam gas (CSG) sector is only forecast to increase slightly over the forecast period. Its ramp-up to the current level has been the key driver behind NEM consumption growth in the last two years, but future growth is expected to be more modest as the liquefied natural gas (LNG) sector exporting most of the CSG has now reached a level close to capacity.
The figure below shows the breakdown of the updated consumption forecast. The black dotted line shows the operational consumption forecast, which is made up of the components shown below the line.
The coloured wedges above the dotted black line show what demand would have been, if the various factors that have reduced demand, and are forecast to reduce demand in future, did not exist. The biggest contributing factors to the slowdown of demand growth in recent years have been the uptake of rooftop PV and energy efficiency measures.
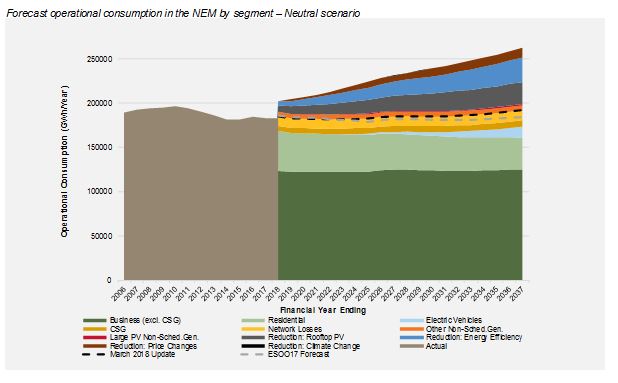
The previous 2017 ESOO forecast is shown as the dotted grey line for comparison. It can be seen that:
-
In the short term the updated forecast is slightly lower. This is driven by the lower CSG forecast.
-
In the medium term (from five to 10 years), the updated forecast is slightly higher, driven by a lower expected electricity price being projected to give a more positive outlook for large manufacturing.
-
In the longer term, beyond 10 years, the updated forecast is increasingly higher than it was, driven by a higher consumption forecast for electric vehicles. By 2036-37, this updated forecast is 8,000 GWh (4.4%) higher than the 2017 ESOO forecast.
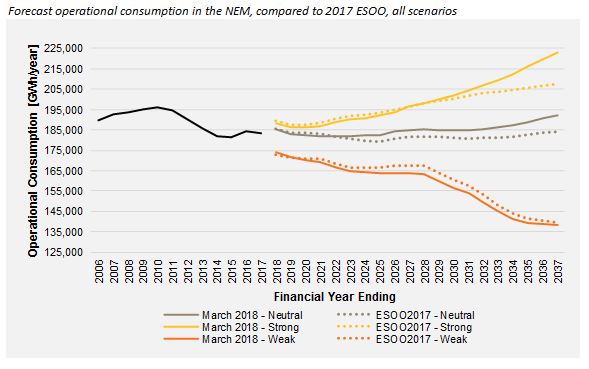
The figure below compares forecasts under all scenarios with those published in the 2017 Electricity Statement of Opportunities.
Under a stronger economic growth forecast, consumption is projected to be 16% higher by 2036-37 than in the Neutral scenario, while weaker economic growth could result in forecast consumption 28% lower than the Neutral scenario at that time.
Maximum and minimum demand
The regional maximum demands are forecast to grow faster than annual consumption, although the key drivers are similar. As rooftop PV reduces grid consumption while the sun shines, increasing installation of PV is shifting the time of maximum demand to later in the day, resulting in maximum demand occurring at evening hours with little or no rooftop PV generation.
The following two tables show forecast regional trends in operational maximum demand (10% probability of exceedance, or POE) and minimum demand (90% POE) respectively.
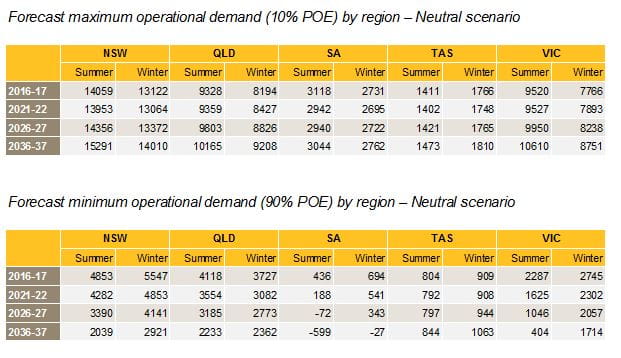
Compared to the 2017 ESOO forecast, updated assumptions around large industrial loads in Victoria, CSG electricity consumption in Queensland, and electric vehicle uptake, have driven the following changes in forecasts:
-
In Victoria, from the early 2020s onwards, the maximum and minimum demand forecasts are now higher in the Neutral scenario. By 2026-27, Victoria’s summer maximum demand is now projected to be 600 MW higher than previously forecast due to changes to industry load forecast and electric vehicle uptake.
-
In Queensland, the maximum and minimum demand forecasts in all scenarios are slightly lower, but follow the same trajectory. In the neutral scenario, in the 10 to 20-year horizon, CSG is trending around 200 MW lower while electricity vehicle uptake towards the end is around 200 MW higher with the two effects netting in the later years.
-
Due to higher projected EV uptake and changes in charging assumptions, both minimum and maximum demand forecasts in all regions and all scenarios project slightly stronger growth in demand over time.