





Frequently Asked Questions (FAQs)
Quarterly Reporting Dashboard
-
How do I navigate to the data?
Once in the Quarterly Reporting Dashboard, scroll down and use the tabs at the bottom to navigate to the various pages. Use the arrow symbols on the left-hand-side of the scroll bar to navigate to tabs to the right or left of the current view.

-
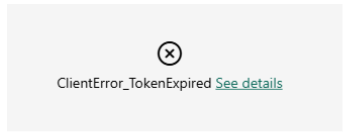
My figures show a “ClientError_TokenExpired” error rather than any data?
This happens if you have been inactive for a while on the page. Please refresh the page to start a new active session.
-
Where can I find out more information about what the figures show?
The ‘Definitions’ tab (see the tabs at the bottom of the dashboard) will give a short summary of most terms. A more in-depth discussion of the various metrics can be found in the AEMO Price Responsive Reporting Guidelines, which can be found within the main UPRR page.
-
What do the filters within the dashboard mean?
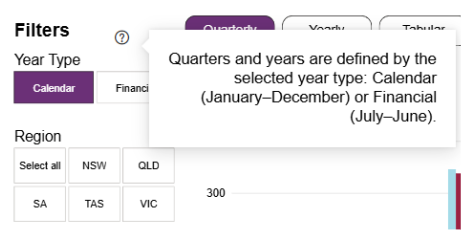
The ‘Definitions’ tab (see the tabs at the bottom of the dashboard) will give a short summary of most terms. Each filter also has a help icon above it, which when hovered over will provide a summary of what each filter represents. Use these filters to filter the visualisations as required.
-
How can I download data within a figure?
Hover over the figure of interest and at the top right of the figure there should be some icons. Click on the ‘More Options’ icon that looks like an ellipsis or 3 horizontal dots, then click ‘Export data’.
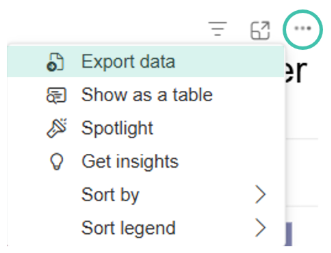
Select the data and file formats available to you and click ‘Export’. This will download a file with the data.
-
Where has the ‘CER trends’ tab moved to?
The Consumer Energy Resources (CER) uptake trends component of the UPRR quarterly reporting is now incorporated into AEMO’s DER Register within a tab named ‘Quarterly Trend Installed Capacity (MW)’. The DER Register is linked within the UPRR portal to act as a single source of information for AEMO’s unscheduled price responsive resources monitoring and reporting.